Python串口助手集成matplotlib实现数据实时波形绘图

本文详细讲解如何使用Python构建串口助手并集成matplotlib实现高帧率数据实时波形显示,通过多线程解耦、定长缓冲队列与增量刷新机制,解决界面卡顿与数据丢包问题。
在嵌入式开发、传感器采集以及工业控制调试中,通过串口接收数据并将其转化为直观的实时波形,是排查信号异常与验证控制算法的关键手段。实现这一需求的核心路径在于:使用 pyserial 建立底层串口通信,利用独立的后台工作线程与线程安全队列(queue.Queue)实现数据采集与界面渲染解耦,并将 matplotlib 图表作为原生组件嵌入到 tkinter 窗口中,最后通过定长双端队列和增量更新策略(set_data)实现平滑不卡顿的动态波形绘制。
一、整体架构与多线程数据流设计
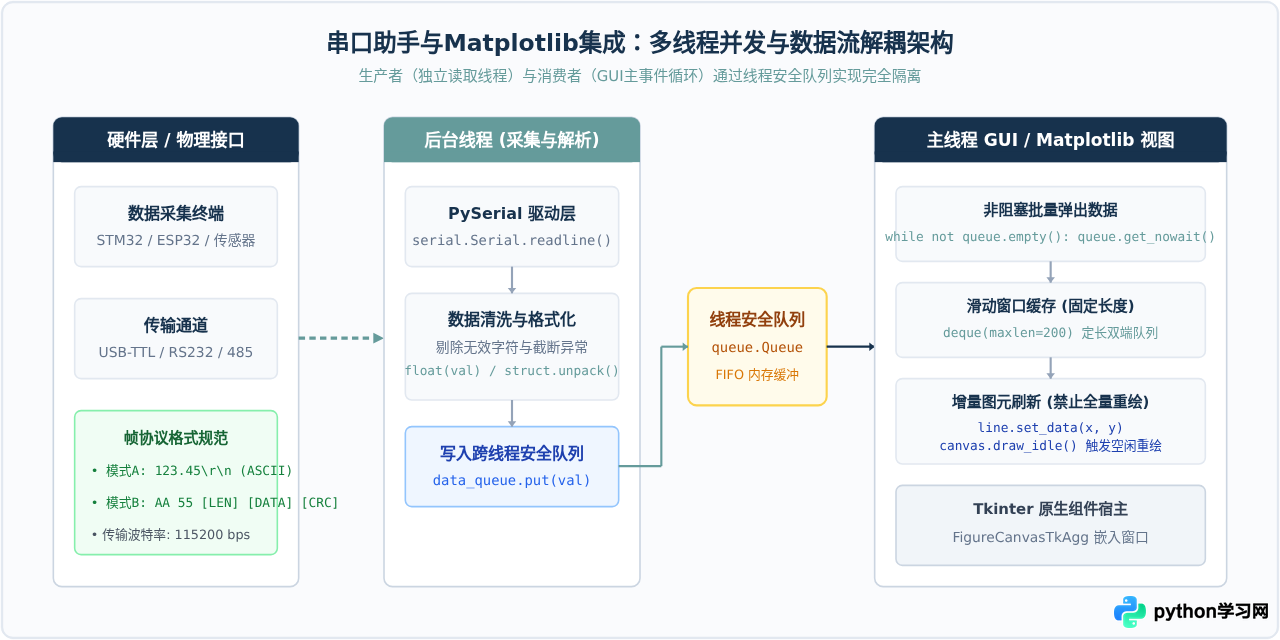
开发实时波形串口助手时,最容易遇到的问题是“界面卡死”或“波形断续”。这是因为串口数据接收是持续且存在网络或I/O等待的阻塞操作,而图形界面(GUI)需要依靠主事件循环来保持窗口响应与重绘。如果将串口读取与图形绘制放在同一个线程中,串口阻塞会导致窗口失去响应,复杂的重绘计算又会导致串口缓冲区溢出丢包。
合理的软件架构必须采用“生产者-消费者”模式进行多线程解耦:后台线程担任生产者,专门负责串口监听、分包解析与校验,将合法的数值推入线程安全的FIFO队列;主线程负责运行 GUI 事件循环,通过定时器定期从队列中提取数据存入滑动窗口缓存,并驱动 matplotlib 进行局部画布重绘。
二、核心实现步骤详解
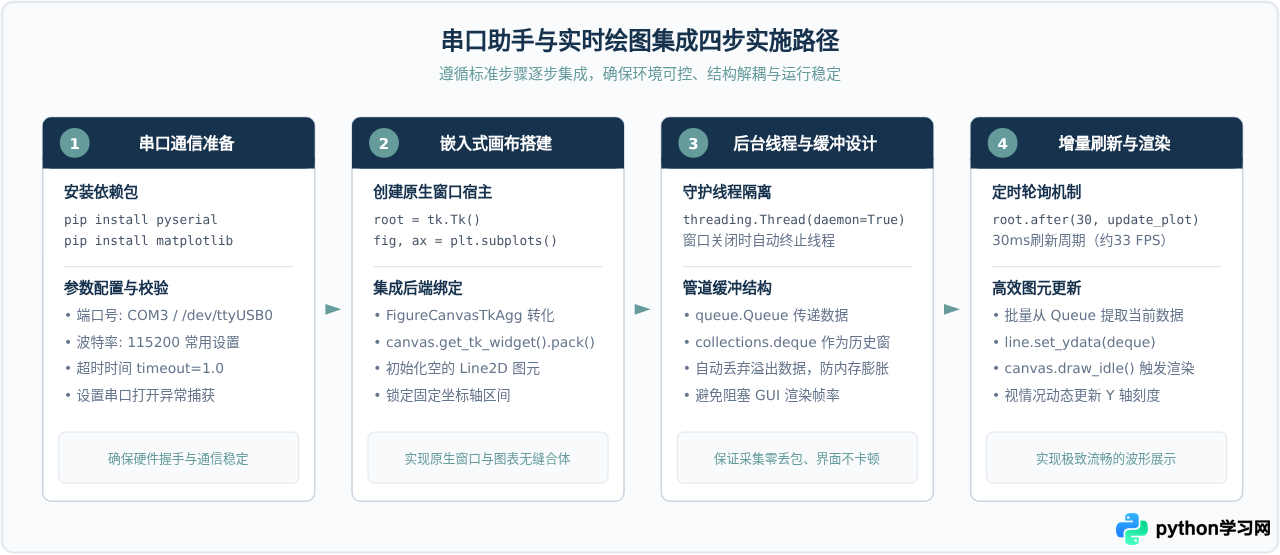
完成集成开发通常分为四个关键阶段:环境准备与串口初始化、构建 GUI 嵌入式画布、建立多线程与安全管道、以及设计定时刷新循环。遵循此顺序可以保证各个技术节点能够逐步独立调试。
三、完整可运行代码实现
下面是一个经过模块化设计的完整示例程序。该脚本使用 Python 原生的 tkinter 构建窗口,利用 matplotlib.backends.backend_tkagg.FigureCanvasTkAgg 嵌入图形画布,使用 pyserial 读取串口,并在无实际物理串口时自动提供“测试模拟数据生成器”,方便读者即使手头没有开发板也能直接验证图形渲染效果。
import sys
import time
import math
import random
import queue
import threading
from collections import deque
import tkinter as tk
from tkinter import ttk, messagebox

import serial
import serial.tools.list_ports
import matplotlib
matplotlib.use("TkAgg")
from matplotlib.figure import Figure
from matplotlib.backends.backend_tkagg import FigureCanvasTkAgg, NavigationToolbar2Tk

class SerialPlotterApp:
    def __init__(self, root):
        self.root = root
        self.root.title("Python串口助手集成Matplotlib实时波形绘图")
        self.root.geometry("960x680")

        # 数据通信与缓存状态
        self.serial_port = None
        self.is_running = False
        self.reader_thread = None
        self.data_queue = queue.Queue()

        # 固定长度的滑动窗口 (显示最新的 200 个数据点)
        self.max_points = 200
        self.y_data = deque([0.0] * self.max_points, maxlen=self.max_points)
        self.x_data = list(range(self.max_points))

        # 界面构建
        self._build_control_panel()
        self._build_matplotlib_canvas()

        # 启动定时刷新循环 (约 30ms 刷新一次,达到 ~33 FPS)
        self.refresh_interval_ms = 30
        self.root.after(self.refresh_interval_ms, self._update_plot_loop)

        # 窗口关闭事件处理
        self.root.protocol("WM_DELETE_WINDOW", self._on_closing)

    def _build_control_panel(self):
        panel = ttk.LabelFrame(self.root, text="串口参数与采集控制", padding=(10, 8))
        panel.pack(side=tk.TOP, fill=tk.X, padx=12, pady=8)

        # 端口选择
        ttk.Label(panel, text="串口号:").pack(side=tk.LEFT, padx=(0, 4))
        self.port_combobox = ttk.Combobox(panel, width=14, state="readonly")
        self._refresh_ports()
        self.port_combobox.pack(side=tk.LEFT, padx=(0, 10))

        # 刷新端口按钮
        ttk.Button(panel, text="刷新端口", command=self._refresh_ports).pack(side=tk.LEFT, padx=(0, 15))

        # 波特率
        ttk.Label(panel, text="波特率:").pack(side=tk.LEFT, padx=(0, 4))
        self.baud_combobox = ttk.Combobox(panel, width=8, state="readonly",
                                          values=["9600", "19200", "38400", "57600", "115200", "921600"])
        self.baud_combobox.set("115200")
        self.baud_combobox.pack(side=tk.LEFT, padx=(0, 15))

        # 模拟模式单选框
        self.simulate_var = tk.BooleanVar(value=False)
        ttk.Checkbutton(panel, text="使用正弦波模拟数据(无需硬件)", variable=self.simulate_var).pack(side=tk.LEFT, padx=(0, 15))

        # 启停按钮
        self.toggle_btn = ttk.Button(panel, text="打开串口并绘图", command=self._toggle_connection)
        self.toggle_btn.pack(side=tk.LEFT, padx=(0, 10))

        # 状态指示标签
        self.status_label = ttk.Label(panel, text="状态: 未连接", foreground="#64748B")
        self.status_label.pack(side=tk.LEFT, padx=10)

    def _build_matplotlib_canvas(self):
        # 创建独立 Figure 容器与坐标系
        self.fig = Figure(figsize=(8, 4.5), dpi=100, facecolor="#FAFBFD")
        self.ax = self.fig.add_subplot(111)
        self.ax.set_facecolor("#FFFFFF")
        self.ax.set_title("实时信号波形图 (Real-time Signal Trace)", fontsize=13, color="#17324D", pad=10)
        self.ax.set_xlabel("采样点序列 (Points)", fontsize=10, color="#4A5568")
        self.ax.set_ylabel("信号幅度 (Amplitude)", fontsize=10, color="#4A5568")
        self.ax.grid(True, linestyle="--", alpha=0.6, color="#CBD5E1")

        # 固定 X 轴范围,初始化空白 Line2D 图元
        self.ax.set_xlim(0, self.max_points - 1)
        self.ax.set_ylim(-1.5, 1.5)
        self.line, = self.ax.plot(self.x_data, list(self.y_data), color="#17324D", lw=1.8, label="CH1")
        self.ax.legend(loc="upper right", framealpha=0.8)

        # 嵌入 Tkinter 原生组件
        self.canvas = FigureCanvasTkAgg(self.fig, master=self.root)
        self.canvas.draw()
        canvas_widget = self.canvas.get_tk_widget()
        canvas_widget.pack(side=tk.TOP, fill=tk.BOTH, expand=True, padx=12, pady=(0, 8))

        # 添加 Matplotlib 工具栏 (支持放大、缩小、重置)
        self.toolbar = NavigationToolbar2Tk(self.canvas, self.root)
        self.toolbar.update()

    def _refresh_ports(self):
        ports = [port.device for port in serial.tools.list_ports.comports()]
        if not ports:
            ports = ["未发现可用串口"]
        self.port_combobox["values"] = ports
        self.port_combobox.current(0)

    def _toggle_connection(self):
        if not self.is_running:
            self._start_acquisition()
        else:
            self._stop_acquisition()

    def _start_acquisition(self):
        if not self.simulate_var.get():
            selected_port = self.port_combobox.get()
            if selected_port == "未发现可用串口":
                messagebox.showerror("错误", "未检测到可用串口,请连接硬件或勾选模拟数据模式。")
                return
            baud = int(self.baud_combobox.get())
            try:
                self.serial_port = serial.Serial(port=selected_port, baudrate=baud, timeout=1.0)
            except Exception as e:
                messagebox.showerror("串口错误", f"无法打开串口 {selected_port}:\n{str(e)}")
                return

        self.is_running = True
        self.toggle_btn.config(text="停止采集")
        self.status_label.config(text="状态: 正在接收数据", foreground="#166534")

        # 启动后台守护线程进行数据读取
        self.reader_thread = threading.Thread(target=self._data_reader_worker, daemon=True)
        self.reader_thread.start()

    def _stop_acquisition(self):
        self.is_running = False
        if self.serial_port and self.serial_port.is_open:
            try:
                self.serial_port.close()
            except Exception:
                pass
            self.serial_port = None

        self.toggle_btn.config(text="打开串口并绘图")
        self.status_label.config(text="状态: 已停止", foreground="#64748B")

    def _data_reader_worker(self):
        """后台线程:负责高频数据采集与入队"""
        sim_step = 0
        while self.is_running:
            if self.simulate_var.get():
                # 模拟正弦波带高斯噪声
                val = math.sin(sim_step * 0.1) + random.uniform(-0.08, 0.08)
                sim_step += 1
                self.data_queue.put(val)
                time.sleep(0.01) # 100Hz 模拟采样率
            else:
                if self.serial_port and self.serial_port.is_open:
                    try:
                        raw_line = self.serial_port.readline()
                        if raw_line:
                            line_str = raw_line.decode("utf-8", errors="ignore").strip()
                            if line_str:
                                val = float(line_str)
                                self.data_queue.put(val)
                    except (ValueError, serial.SerialException):
                        continue
                else:
                    break

    def _update_plot_loop(self):
        """主线程定时回调:批量提取数据并增量刷新画布"""
        if self.is_running:
            has_new_data = False
            # 批量清空队列,避免延迟累积
            while not self.data_queue.empty():
                try:
                    val = self.data_queue.get_nowait()
                    self.y_data.append(val)
                    has_new_data = True
                except queue.Empty:
                    break

            if has_new_data:
                # 增量修改已有折线的数值数组
                self.line.set_ydata(list(self.y_data))

                # 动态自适应调整 Y 轴范围
                curr_min = min(self.y_data)
                curr_max = max(self.y_data)
                if curr_min != curr_max:
                    margin = (curr_max - curr_min) * 0.15
                    self.ax.set_ylim(curr_min - margin, curr_max + margin)

                # 空闲时绘制,避免阻塞事件响应
                self.canvas.draw_idle()

        # 循环注册下一次更新
        self.root.after(self.refresh_interval_ms, self._update_plot_loop)

    def _on_closing(self):
        self._stop_acquisition()
        self.root.destroy()
        sys.exit(0)

if __name__ == "__main__":
    tk_root = tk.Tk()
    app = SerialPlotterApp(tk_root)
    tk_root.mainloop()
四、实时绘图的关键性能优化与防卡顿策略
在实时波形系统中,如果直接套用初学 matplotlib 时的 plt.plot() 和 plt.cla() 方式,当串口数据频率超过 50Hz 时,界面就会出现肉眼可见的掉帧、甚至因频繁分配释放图元对象导致 Python 垃圾回收频繁停顿。
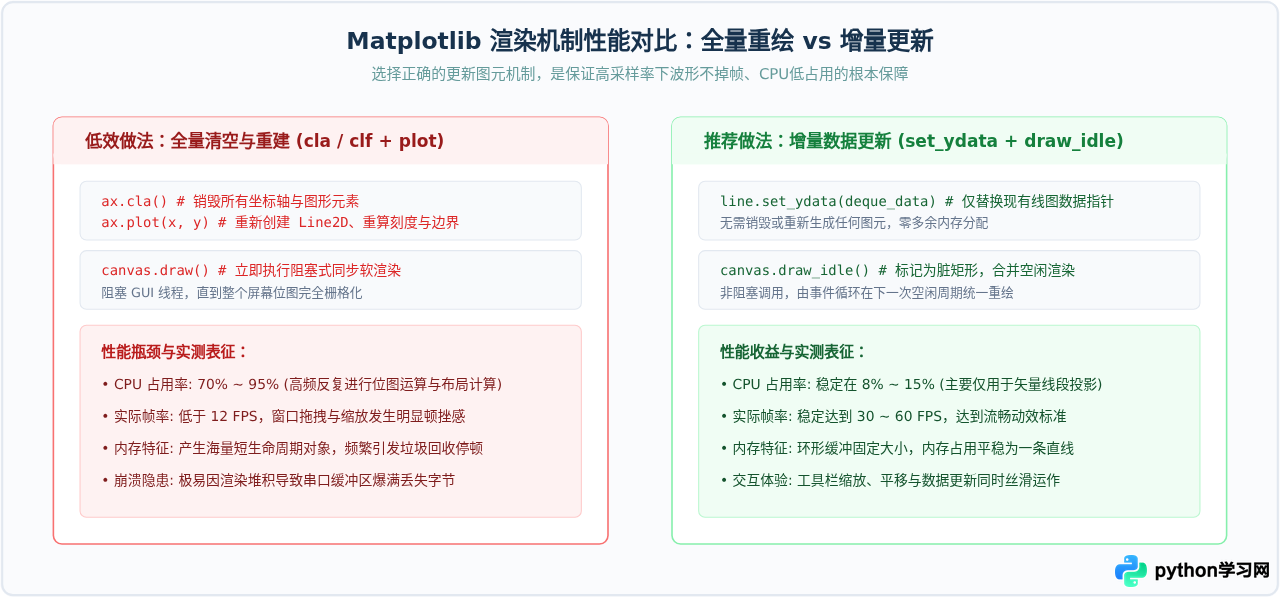
要构建生产级的高性能波形助手,建议严格落实以下三项工程策略:
- 使用定长队列(
collections.deque(maxlen=N)): 普通 Python 列表在执行pop(0)时时间复杂度为O(n),会引起底层数组移动;而deque基于双向链表,尾部添加与头部弹出均为O(1),设定maxlen后超过长度会自动丢弃旧数据,天然构成平滑的滑动时间窗。 - 避免无意义的自适应范围计算: 如果信号上下限已知(如 ADC 为 0~3.3V 或加速度计 ±2g),应直接在初始化时固定
ax.set_ylim()。仅在信号动态范围极其不可控时,才在数据极大/极小值突破当前边界时按需缩放。 - 分批提取与限帧渲染: 数据采集往往是以数百赫兹甚至千赫兹发生的,但人眼显示刷新率仅需 30~60Hz。在每次
root.after()回调中,使用while not data_queue.empty()将积攒的这 30ms 内的数据一次性读完注入滑动窗,然后只执行一次draw_idle()。这既保留了最新的信号形态,又避免了高频渲染榨干 CPU。
五、常见问题排查与健壮性处理
在实际硬件对接与长时间连续运行中,可能遇到串口断开、数据断包或多线程无法退出的情况。下表归纳了最典型的异常表现及具体的修复方案:
| 问题表现 | 诱发根因 | 排查与工程修复方案 |
|---|---|---|
SerialException: [Errno 13] Permission denied 或 [Errno 16] Resource busy |
串口被其他串口监控软件(如串口调试助手、PlatformIO)独占,或当前系统未给读写权限。 | 关闭占用该端口的第三方软件;在 Linux/macOS 环境下,确认当前用户已被添加至 dialout 权限用户组(例如 sudo usermod -a -G dialout $USER)。 |
波形突发垂直毛刺或报错 ValueError: could not convert string to float |
串口插拔或启动瞬态导致的半包(数据被截断)或字符串包含不可见控制字符。 | 对 readline() 的字符串做 strip() 处理;解析时置入 try...except ValueError 结构;更严谨的场合应在协议中加入帧头(如 0xAA 0x55)、长度与校验和。 |
| 点击关闭窗口后,后台线程仍在运行,终端不退出 | 创建读取子线程时未将其配置为守护线程(Daemon Thread)。 | 启动线程前明确标记 thread.daemon = True;或在窗口关闭事件 WM_DELETE_WINDOW 中通过信号标志位(如 self.is_running = False)配合 join() 优雅等待子线程安全退出。 |
| 长时间运行后波形延迟越来越明显,波形落后实际物理时间数秒 | 采集线程入队速率高于 GUI 刷新处理速率,队列中积压了大量陈旧数据。 | 限制 queue.Queue(maxsize=1000) 或在每轮刷新时限制单次取出的最新样本量;若积压过大,直接清空旧数据只保留最新的滑动窗口量。 |
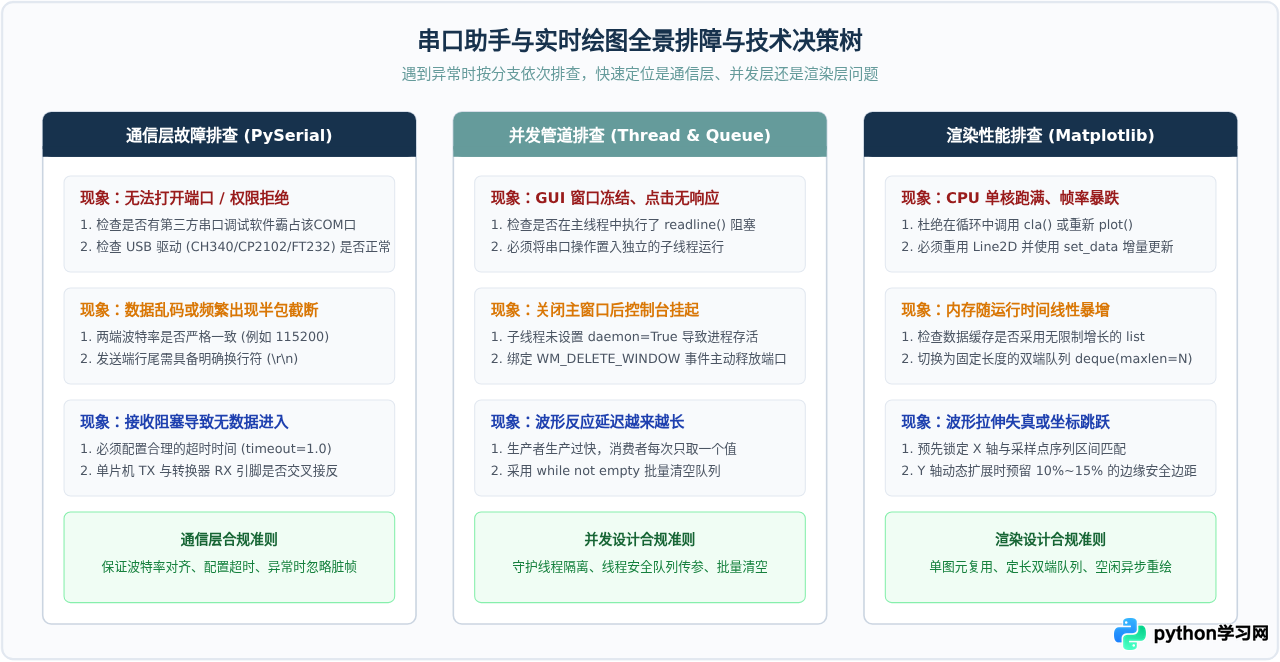
将 matplotlib 集成进 Python 串口助手是一套轻量、标准且无需配置沉重第三方 C++ 依赖的高可用方案。对于 100Hz 以内的常规工业传感器波形监控,通过“后台守护线程采集 + queue.Queue 数据搬运 + deque 定长滑动窗 + line.set_ydata() 增量刷新”,便能在极低资源占用下获得高平滑度的图形体验。若未来有更高频率(如 1kHz 以上或多通道超高密度振动信号分析)的极限要求,可在保留现有“多线程采集与数据队列”解耦架构的前提下,将前端渲染画布平滑替换为基于 OpenGL 加速的 pyqtgraph,核心解耦思想完全一致。
免责声明:本文内容仅供参考,不代表本站观点。转载或引用请注明出处。