Python小波分析库Pywavelets入门:阈值处理与信号分解实战

发布时间:2026-10-13| 3人浏览过
本文介绍Python小波分析库Pywavelets的基础应用,重点解析pywt.threshold函数的阈值处理模式及离散小波变换(DWT)的信号分解流程。通过具体代码示例,展示如何对数据序列进行多层分解与重构,适用于信号处理初学者参考。
Pywavelets库简介与阈值处理示例
本文旨在介绍Python语言中的小波分析库Pywavelets,并分享相关使用经验,供读者参考。
# -*- coding: utf-8 -*-
import numpy as np
import math
import matplotlib.pyplot as plt
import pandas as pd
import datetime
from scipy import interpolate
from pandas import DataFrame,Series

import numpy as np
import pywt

data = np.linspace(1, 4, 7)

# pywt.threshold方法讲解:
#        pywt.threshold(data,value,mode ='soft',substitute = 0 )
#        data:数据集,value:阈值,mode:比较模式默认soft,substitute:替代值,默认0,float类型

#data:  [ 1.  1.5 2.  2.5 3.  3.5 4. ]
#output:[ 6.  6.  0.  0.5 1.  1.5 2. ]
#soft 因为data中1小于2,所以使用6替换,因为data中第二个1.5小于2也被替换,2不小于2所以使用当前值减去2,,2.5大于2,所以2.5-2=0.5.....

print(pywt.threshold(data, 2, 'soft',6))


#data:  [ 1.  1.5 2.  2.5 3.  3.5 4. ]
#hard data中绝对值小于阈值2的替换为6,大于2的不替换
print (pywt.threshold(data, 2, 'hard',6))


#data:  [ 1.  1.5 2.  2.5 3.  3.5 4. ]
#data中数值小于阈值的替换为6,大于等于的不替换
print (pywt.threshold(data, 2, 'greater',6) )

print (data )
#data:  [ 1.  1.5 2.  2.5 3.  3.5 4. ]
#data中数值大于阈值的,替换为6
print (pywt.threshold(data, 2, 'less',6) )
[6. 6. 0. 0.5 1. 1.5 2. ] [6. 6. 2. 2.5 3. 3.5 4. ] [6. 6. 2. 2.5 3. 3.5 4. ] [1. 1.5 2. 2.5 3. 3.5 4. ] [1. 1.5 2. 6. 6. 6. 6. ]
信号的小波分解与重构流程
#!/usr/bin/env python
# -*- coding: utf-8 -*-

import numpy as np
import matplotlib.pyplot as plt

import pywt
import pywt.data


ecg = pywt.data.ecg()

data1 = np.concatenate((np.arange(1, 400),
            np.arange(398, 600),
            np.arange(601, 1024)))
x = np.linspace(0.082, 2.128, num=1024)[::-1]
data2 = np.sin(40 * np.log(x)) * np.sign((np.log(x)))

mode = pywt.Modes.smooth


def plot_signal_decomp(data, w, title):
  """Decompose and plot a signal S.
  S = An + Dn + Dn-1 + ... + D1
  """
  w = pywt.Wavelet(w)#选取小波函数
  a = data
  ca = []#近似分量
  cd = []#细节分量
  for i in range(5):
    (a, d) = pywt.dwt(a, w, mode)#进行5阶离散小波变换
    ca.append(a)
    cd.append(d)

  rec_a = []
  rec_d = []

  for i, coeff in enumerate(ca):
    coeff_list = [coeff, None] + [None] * i
    rec_a.append(pywt.waverec(coeff_list, w))#重构

  for i, coeff in enumerate(cd):
    coeff_list = [None, coeff] + [None] * i
    if i ==3:
      print(len(coeff))
      print(len(coeff_list))
    rec_d.append(pywt.waverec(coeff_list, w))

  fig = plt.figure()
  ax_main = fig.add_subplot(len(rec_a) + 1, 1, 1)
  ax_main.set_title(title)
  ax_main.plot(data)
  ax_main.set_xlim(0, len(data) - 1)

  for i, y in enumerate(rec_a):
    ax = fig.add_subplot(len(rec_a) + 1, 2, 3 + i * 2)
    ax.plot(y, 'r')
    ax.set_xlim(0, len(y) - 1)
    ax.set_ylabel("A%d" % (i + 1))

  for i, y in enumerate(rec_d):
    ax = fig.add_subplot(len(rec_d) + 1, 2, 4 + i * 2)
    ax.plot(y, 'g')
    ax.set_xlim(0, len(y) - 1)
    ax.set_ylabel("D%d" % (i + 1))


#plot_signal_decomp(data1, 'coif5', "DWT: Signal irregularity")
#plot_signal_decomp(data2, 'sym5',
#          "DWT: Frequency and phase change - Symmlets5")
plot_signal_decomp(ecg, 'sym5', "DWT: Ecg sample - Symmlets5")


plt.show()
72 5
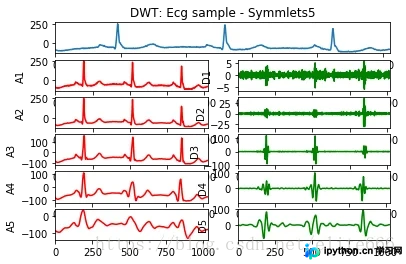
对数据序列执行小波分解时,每一层分解会将上一层得到的低频信号进一步拆分为低频和高频两部分。经过N层分解后,原始信号X可表示为:X = D1 + D2 + … + DN + AN。其中,D1至DN分别代表第1层至第N层分解得到的高频信号,AN则是第N层分解得到的低频信号。
以上内容为本文的全部介绍,希望能为读者的学习提供一定帮助,同时也欢迎大家继续支持本站。
免责声明:本文内容仅供参考,不代表本站观点。转载或引用请注明出处。