Python实现平稳时间序列ARMA建模与预测全流程

本文详细讲解利用Python进行平稳时间序列建模的完整流程。从数据预处理开始,通过ADF检验确认序列平稳性,利用Ljung-Box检验排除白噪声。接着介绍如何结合ACF/PACF图与AIC/BIC统计量确定ARMA模型阶数,并展示AR(1)模型的拟合、参数估计及未来走势预测代码实现,为时间序列分析提供实用参考。
平稳序列建模基本步骤
一、平稳序列建模步骤
若经预处理后的观察值序列被判定为平稳且非白噪声,即可采用ARMA模型对其进行建模。具体实施步骤如下:
(1)计算该观察值序列的样本自相关系数(ACF)与样本偏自相关系数(PACF)。
(2)依据样本自相关系数及偏自相关系数的特征,选取合适的ARMA(p,q)模型进行拟合。
(3)对模型中的位置参数进行估计。
(4)验证模型有效性。若未通过检验,需返回步骤(2)重新选择模型并再次拟合。
(5)模型优化。即使模型通过检验,仍建议返回步骤(2),综合考量多种情况构建多个候选模型,并从所有通过检验的模型中筛选出最优者。
(6)基于最终拟合的模型,对序列的未来走势进行预测。
Python代码实现与模型构建
二、代码实现
时序图绘制与数据分布观察
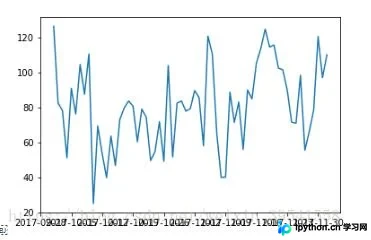
1、绘制时序图,查看数据的大概分布
trainSeting.head()
Out[36]:
date
2017-10-01 126.4
2017-10-02  82.4
2017-10-03  78.1
2017-10-04  51.1
2017-10-05  90.9
Name: sales, dtype: float64

plt.plot(trainSeting)
平稳性检验:ADF检验
2、平稳性检验
'''进行ADF检验
adf_test的返回值
Test statistic:代表检验统计量
p-value:代表p值检验的概率
Lags used:使用的滞后k,autolag=AIC时会自动选择滞后
Number of Observations Used:样本数量
Critical Value(5%) : 显著性水平为5%的临界值。
(1)假设是存在单位根,即不平稳;
(2)显著性水平,1%:严格拒绝原假设;5%:拒绝原假设,10%类推。
(3)看P值和显著性水平a的大小,p值越小,小于显著性水平的话,就拒绝原假设,认为序列是平稳的;大于的话,不能拒绝,认为是不平稳的
(4)看检验统计量和临界值,检验统计量小于临界值的话,就拒绝原假设,认为序列是平稳的;大于的话,不能拒绝,认为是不平稳的
'''
#滚动统计
def rolling_statistics(timeseries):
 #Determing rolling statistics
 rolmean = pd.rolling_mean(timeseries, window=12)
 rolstd = pd.rolling_std(timeseries, window=12)

 #Plot rolling statistics:
 orig = plt.plot(timeseries, color='blue',label='Original')
 mean = plt.plot(rolmean, color='red', label='Rolling Mean')
 std = plt.plot(rolstd, color='black', label = 'Rolling Std')
 plt.legend(loc='best')
 plt.title('Rolling Mean & Standard Deviation')
 plt.show(block=False)

##ADF检验
from statsmodels.tsa.stattools import adfuller
def adf_test(timeseries):
 rolling_statistics(timeseries)#绘图
 print ('Results of Augment Dickey-Fuller Test:')
 dftest = adfuller(timeseries, autolag='AIC')
 dfoutput = pd.Series(dftest[0:4], index=['Test Statistic','p-value','#Lags Used','Number of Observations Used'])
 for key,value in dftest[4].items():
  dfoutput['Critical Value (%s)'%key] = value #增加后面的显著性水平的临界值
 print (dfoutput)

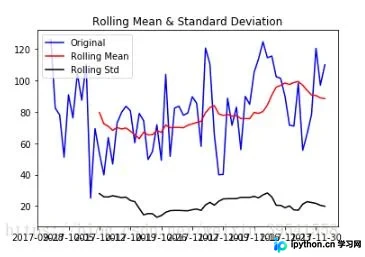
adf_test(trainSeting) #从结果中可以看到p值为0.1097>0.1,不能拒绝H0,认为该序列不是平稳序列
返回结果如下
Results of Augment Dickey-Fuller Test:
Test Statistic    -5.718539e+00
p-value      7.028398e-07
#Lags Used      0.000000e+00
Number of Observations Used 6.200000e+01
Critical Value (1%)   -3.540523e+00
Critical Value (5%)   -2.909427e+00
Critical Value (10%)   -2.592314e+00
dtype: float64
由上述结果可知,p值小于0.05,据此可认为该序列属于平稳时间序列。
白噪声检验:Ljung-Box检验
3、白噪声检验
'''acorr_ljungbox(x, lags=None, boxpierce=False)函数检验无自相关
lags为延迟期数,如果为整数,则是包含在内的延迟期数,如果是一个列表或数组,那么所有时滞都包含在列表中最大的时滞中
boxpierce为True时表示除开返回LB统计量还会返回Box和Pierce的Q统计量
返回值:
lbvalue:测试的统计量
pvalue:基于卡方分布的p统计量
bpvalue:((optionsal), float or array) – test statistic for Box-Pierce test
bppvalue:((optional), float or array) – p-value based for Box-Pierce test on chi-square distribution
'''
from statsmodels.stats.diagnostic import acorr_ljungbox
def test_stochastic(ts,lag):
 p_value = acorr_ljungbox(ts, lags=lag) #lags可自定义
 return p_value
test_stochastic(trainSeting,[6,12]) Out[62]: (array([13.28395274, 14.89281684]), array([0.03874194, 0.24735042]))
分析上述结果可见,延迟6阶时的p值为0.03且小于0.05,因此拒绝原假设,判定该序列并非白噪声序列。
ARMA模型阶数确定方法
4、确定ARMA的阶数
(1)利用自相关图和偏自相关图进行判断
####自相关图ACF和偏相关图PACF
import statsmodels.api as sm
def acf_pacf_plot(ts_log_diff):
 sm.graphics.tsa.plot_acf(ts_log_diff,lags=40) #ARIMA,q
 sm.graphics.tsa.plot_pacf(ts_log_diff,lags=40) #ARIMA,p

acf_pacf_plot(trainSeting) #查看数据的自相关图和偏自相关图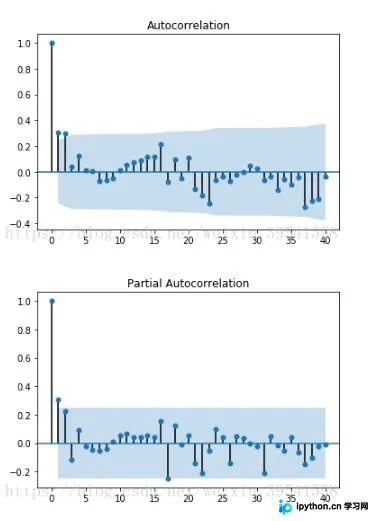
(2)借助AIC、BIC统计量自动确定阶数
##借助AIC、BIC统计量自动确定
from statsmodels.tsa.arima_model import ARMA
def proper_model(data_ts, maxLag):
 init_bic = float("inf")
 init_p = 0
 init_q = 0
 init_properModel = None
 for p in np.arange(maxLag):
  for q in np.arange(maxLag):
   model = ARMA(data_ts, order=(p, q))
   try:
    results_ARMA = model.fit(disp=-1, method='css')
   except:
    continue
   bic = results_ARMA.bic
   if bic < init_bic:
    init_p = p
    init_q = q
    init_properModel = results_ARMA
    init_bic = bic
 return init_bic, init_p, init_q, init_properModel

proper_model(trainSeting,40)
#在statsmodels包里还有更直接的函数:
import statsmodels.tsa.stattools as st
order = st.arma_order_select_ic(ts_log_diff2,max_ar=5,max_ma=5,ic=['aic', 'bic', 'hqic'])
order.bic_min_order
'''
我们常用的是AIC准则,AIC鼓励数据拟合的优良性但是尽量避免出现过度拟合(Overfitting)的情况。所以优先考虑的模型应是AIC值最小的那一个模型。
为了控制计算量,我们限制AR最大阶不超过5,MA最大阶不超过5。 但是这样带来的坏处是可能为局部最优。
timeseries是待输入的时间序列,是pandas.Series类型,max_ar、max_ma是p、q值的最大备选值。
order.bic_min_order返回以BIC准则确定的阶数,是一个tuple类型
返回值如下:
order.bic_min_order Out[13]: (1, 0)
模型拟合与未来走势预测
5、建模
依据前述结果,可选用AR(1)模型进行建模。
################################模型######################################
# AR模型,q=0
#RSS是残差平方和
# disp为-1代表不输出收敛过程的信息,True代表输出
from statsmodels.tsa.arima_model import ARIMA
model = ARIMA(trainSeting,order=(1,0,0)) #第二个参数代表使用了二阶差分
results_AR = model.fit(disp=-1)
plt.plot(trainSeting)
plt.plot(results_AR.fittedvalues, color='red') #红色线代表预测值
plt.title('RSS:%.4f' % sum((results_AR.fittedvalues-trainSeting)**2))#残差平方和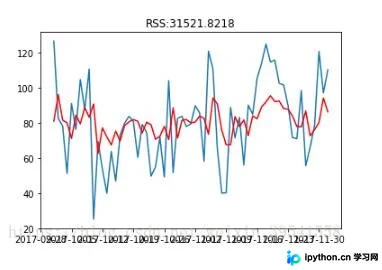
6、预测未来走势
############################预测未来走势##########################################
# forecast方法会自动进行差分还原,当然仅限于支持的1阶和2阶差分
forecast_n = 12 #预测未来12个天走势
forecast_AR = results_AR.forecast(forecast_n)
forecast_AR = forecast_AR[0]
print (forecast_AR)
print (forecast_ARIMA_log) [90.49452199 84.05407353 81.92752342 81.22536496 80.99352161 80.91697003
80.89169372 80.88334782 80.88059211 80.87968222 80.87938178 80.87928258]
##将预测的数据和原来的数据绘制在一起,为了实现这一目的,我们需要增加数据索引,使用开源库arrow:
import arrow
def get_date_range(start, limit, level='day',format='YYYY-MM-DD'):
 start = arrow.get(start, format)
 result=(list(map(lambda dt: dt.format(format) , arrow.Arrow.range(level, start,limit=limit))))
 dateparse2 = lambda dates:pd.datetime.strptime(dates,'%Y-%m-%d')
 return map(dateparse2, result)

# 预测从2017-12-03开始,也就是我们训练数据最后一个数据的后一个日期
new_index = get_date_range('2017-12-03', forecast_n)
forecast_ARIMA_log = pd.Series(forecast_AR, copy=True, index=new_index)
print (forecast_ARIMA_log.head())
##绘图如下
plt.plot(trainSeting,label='Original',color='blue')
plt.plot(forecast_ARIMA_log, label='Forcast',color='red')
plt.legend(loc='best')
plt.title('forecast')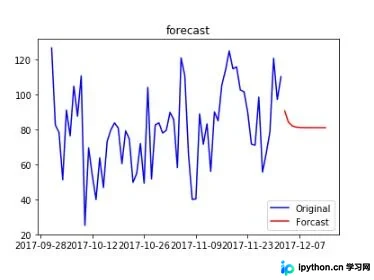
以上即为利用Python实现平稳时间序列建模的完整内容,旨在为读者提供参考与帮助,欢迎支持。
免责声明:本文内容仅供参考,不代表本站观点。转载或引用请注明出处。